Summary Chart
Topics on this posts:
Overview
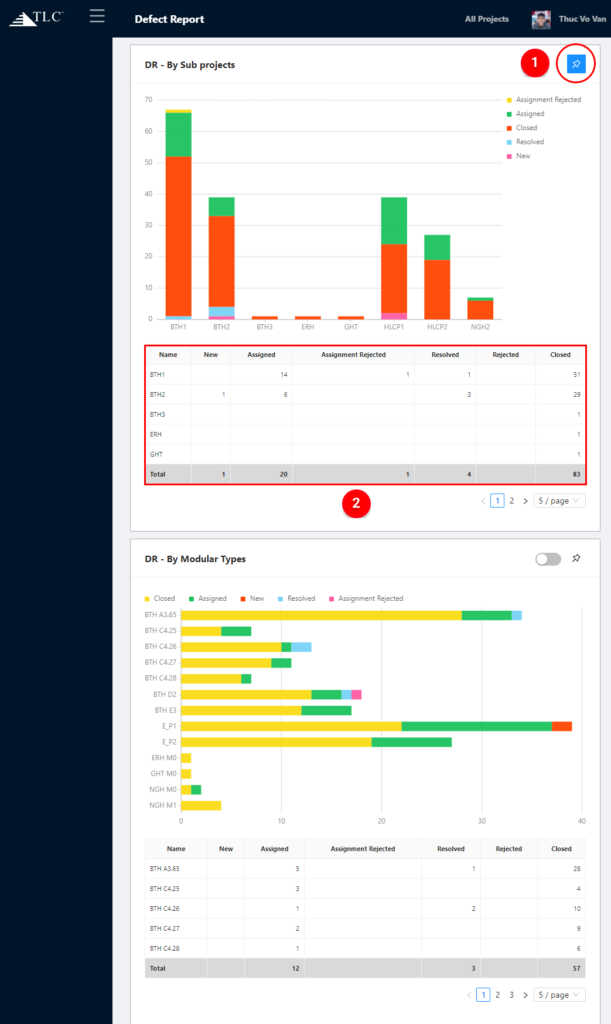
This page shows you reports by the types of charts and the data table. It is real-time which means it will update automatically if having any new post created or the status changed to.
Navigation
To get the Summary of every minor app, please see App Overview.
Structure
The summary includes two parts: ![]() the tool and
the tool and ![]() the chart and data table.
the chart and data table.
- The tool bar: you can click on the pin button to pin the chart to the dashboard if you need to track this chart. You also can open/close the pill button to show the data table fully or not.
- The chart and the data table: shown by fields of the minor app (Project, Subproject, Report Date, Reporter/Creator,…). The table types (column, pie, line, bar) depending on the data types of these fields.
